Cold Email Benchmarks 2026
What counts as a good cold email open rate, reply rate and bounce rate — plus why open rate has become the least trustworthy number on your dashboard.
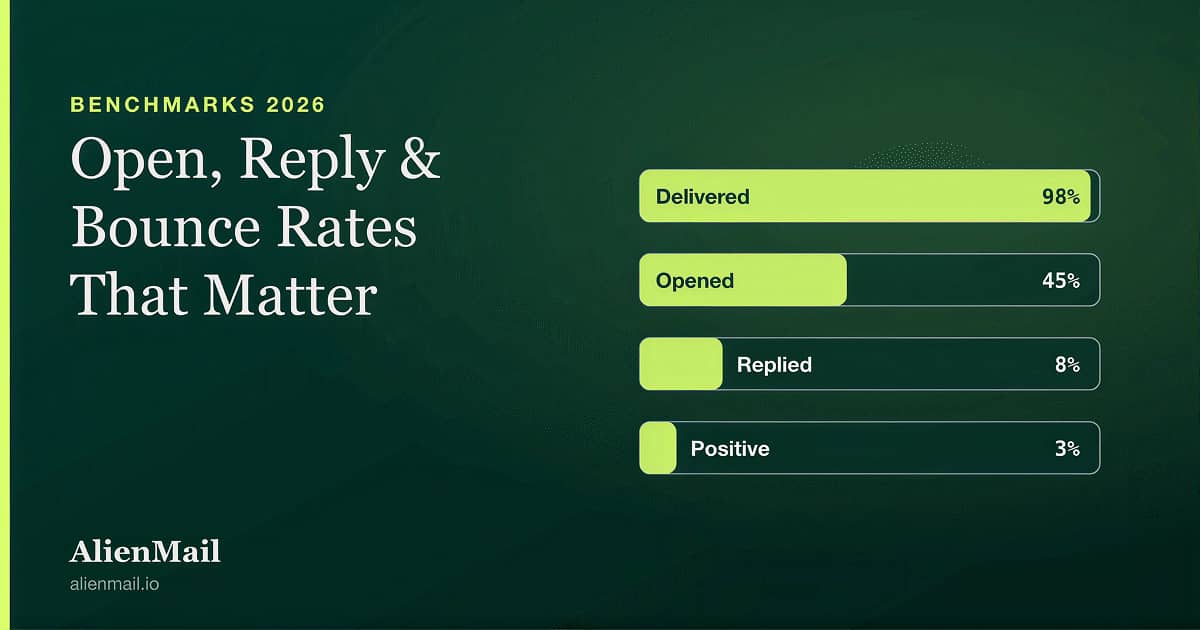

Cold email benchmarks are useful for one purpose: telling you which part of your funnel is broken. A campaign with high opens and no replies has a copy problem. A campaign with low opens has a deliverability problem. A campaign with high bounces has a list problem. The numbers point to the fix.
What they are not useful for is comparing yourself against an industry average, because "cold email" spans everything from a hyper-targeted 50-contact list to a 50,000-contact blast. Use these ranges diagnostically, not competitively.
The benchmark table
MetricPoorAverageGoodExcellent Open rateUnder 20%20–40%40–60%Above 60% Reply rateUnder 1%1–5%5–10%Above 10% Positive reply rateUnder 0.5%0.5–2%2–5%Above 5% Bounce rateAbove 5%2–5%1–2%Under 1% Spam complaint rateAbove 0.3%0.1–0.3%Under 0.1%Near zero Inbox placementUnder 70%70–85%85–95%Above 95%
Two caveats before you use these. Highly targeted campaigns to 100 well-researched contacts routinely exceed the "excellent" column, and that is normal, not exceptional. And the open rate row should be read with the scepticism explained below.
Why open rate has stopped meaning much
Open tracking works by embedding an invisible image; when the client loads it, an open is recorded. Three things have broken this:
Apple Mail Privacy Protection pre-fetches images for every message regardless of whether the recipient reads it. Any Apple Mail recipient registers as an open automatically.
Corporate security gateways scan inbound mail by fetching linked and embedded resources, generating both false opens and false clicks.
Image blocking in many clients does the reverse, hiding genuine opens.
The result is a number inflated by bots and deflated by privacy settings, in proportions you cannot measure. A campaign reporting 65% opens might genuinely be at 30%.
Use open rate for one thing only: relative comparison between two subject lines sent to the same audience through the same infrastructure in the same week. As an absolute measure of interest, it is no longer reliable — and a sudden collapse in open rate is more likely a deliverability signal than a copy signal.
Reply rate: the metric that survives
A reply requires a human to read the message and type. It cannot be faked by a scanner. This makes reply rate the only engagement metric worth optimising directly — and it is also what mailbox providers weight most heavily when scoring your reputation.
Split it in two:
Total reply rate includes out-of-office, "not the right person", and unsubscribes. Useful as a deliverability proxy — if it is near zero, your mail probably is not landing.
Positive reply rate counts only genuine interest. This is the number that predicts pipeline.
A campaign at 8% total replies but 0.4% positive replies is reaching inboxes and failing on relevance — you are talking to the wrong people, or about the wrong thing.
Bounce rate: the metric that ends campaigns
Bounces are the fastest route to a damaged domain, and unlike the others this one has a hard threshold rather than a target.
Under 2% — healthy.
2–5% — your list is decaying; re-verify before the next send.
Above 5% — stop. Providers read this as evidence of a purchased or scraped list and begin filtering everything from the domain.
Distinguish hard bounces (address does not exist — permanent) from soft bounces (mailbox full, server temporarily unavailable). Hard bounces must be suppressed immediately and permanently. Repeatedly sending to an address that has hard bounced is one of the clearest bad-sender signals available.
B2B email addresses decay at roughly 2% per month as people change roles, which means a list verified six months ago is already around 12% invalid. Verify immediately before each send, not when you built the list.
Diagnosing your campaign from the numbers
PatternMost likely causeFix Low opens, low replies, low bouncesDeliverability — you are in spamSeed test placement, check authentication, return to warm-up High opens, near-zero repliesCopy or targetingRewrite the offer; verify you are contacting the right role High bounce rateStale or purchased listRe-verify, suppress hard bounces, stop buying lists Good week one, collapse in week threeVolume ramped too fast, or reputation decayingCut per-inbox volume, add inboxes, keep warm-up running Replies but all negativeWrong audience or aggressive toneTighten ICP; soften the ask in the first touch Good on Gmail, bad on OutlookProvider-specific filteringCheck DKIM alignment; Microsoft weights authentication heavily
What actually moves reply rate
In rough order of impact:
List quality. The right 200 people beat the wrong 5,000. Nothing in the copy compensates for contacting someone with no plausible use for the product.
Deliverability. An unread message cannot reply. If placement is below 85%, fix that before touching the copy.
Relevance of the first line. Specific and verifiable beats flattering and generic — a real observation about their business outperforms "I loved your recent post".
Brevity. Under 125 words consistently outperforms longer first-touch messages.
A single, small ask. "Worth a quick look?" converts better than "book 30 minutes here".
Follow-ups. Most replies arrive on touches two through four. A one-email campaign leaves the majority of its results unclaimed.
Send timing. Real but marginal — Tuesday to Thursday morning in the recipient's time zone is a reasonable default. Do not over-optimise this before the six items above.
Measuring accurately
Three practices to make your own numbers trustworthy:
Maintain a seed list. Your own addresses across Gmail, Outlook, Yahoo and a corporate Microsoft 365 tenant, included in every campaign, so you observe placement directly rather than inferring it.
Track per-inbox, not just per-campaign. One degrading mailbox can drag an otherwise healthy campaign's averages down, and you cannot see it in aggregate.
Compare like with like. A/B test one variable at a time, to the same audience, in the same week, through the same inboxes.
AlienMail reports reply rate, bounce rate and per-inbox deliverability health alongside a live placement score, so a failing mailbox is visible before it affects the domain. See the deliverability suite.
Frequently asked questions
What is a good cold email open rate?
40–60% is a reasonable target, but treat it as approximate — Apple Mail Privacy Protection and security scanners inflate the number, so use it only to compare subject lines within the same campaign infrastructure.
What is a good cold email reply rate?
5–10% total replies is good; above 10% is excellent. For positive replies specifically, 2–5% is good. Tightly targeted small-list campaigns routinely exceed both.
What bounce rate is acceptable?
Under 2%. Between 2% and 5% means re-verify before your next send. Above 5%, stop sending — providers will begin filtering the whole domain.
Why did my open rate suddenly drop?
Usually deliverability rather than copy. Run a seed test, verify SPF/DKIM/DMARC still pass, and check your domain against blocklists before rewriting subject lines.
How many follow-ups should a sequence have?
Three to five touches spread over two to three weeks captures most of the available replies. Beyond that, incremental replies fall sharply while complaint risk rises.
Your next campaign is six minutes away
Connect your business and let Alien AI handle the writing, structuring, and optimizing.
Generate my Business DNA — free